NFL Prop Betting Strategy: Expert Tips to Find Value and Win More
The difference between recreational prop bettors and profitable ones rarely comes down to football knowledge alone. Most serious NFL fans understand the game at a level sufficient to form intelligent opinions about player performance. What separates winners from losers is methodology: the systematic approaches used to identify value, the analytical frameworks applied to assess probability, and the discipline exercised in execution.
Prop betting rewards a specific kind of preparation. Unlike point spread betting where public perception and sharp money shape efficient markets, player props often harbor inefficiencies that diligent research can exploit. Sportsbooks devote their most sophisticated modeling to high-volume markets like spreads and totals. The prop market receives less attention, creating opportunities for bettors willing to do work that casual players skip.
Strategy matters because the juice on props runs higher than on traditional bets. Standard prop pricing at -110 on both sides implies roughly a 52.4% break-even threshold. To profit over time, you need to identify situations where your true probability exceeds that threshold by enough margin to overcome the vig. Random betting produces predictable losses. Strategic betting creates the possibility of sustainable profits.
This guide provides a comprehensive framework for approaching NFL prop bets analytically. The concepts apply across all prop categories, from quarterback passing yards to defensive sacks, though specific applications vary by market. Building these skills takes time and effort, but the investment pays dividends for bettors committed to treating prop betting as a serious pursuit rather than entertainment spending.

Research Fundamentals
Effective prop betting research goes beyond checking season averages on a statistics website. The numbers that matter most are often buried beneath surface-level stats, and developing the ability to find and interpret them creates meaningful edges.
Using statistics beyond averages represents the first step toward sophisticated analysis. When a sportsbook sets a passing yards line at 265.5, they are not simply taking the quarterback’s season average and adding or subtracting based on matchup. Their models incorporate factors that recreational bettors often ignore: home versus road splits, performance by game total range, results against similar defensive profiles, and much more. Matching this depth of analysis requires building your own database of relevant statistics.
The median versus mean distinction proves particularly valuable for prop betting. Mean averages get skewed by outlier performances, while medians better represent typical outcomes. A running back who rushes for 120 yards twice and 50 yards four times averages 73 yards, but his median is closer to 50. If the prop line sits at 65.5, the average suggests the over while the median suggests the under. Medians provide a more reliable baseline for projecting single-game performance.
Hit rates and consistency metrics complement volume statistics. A receiver who averages 70 receiving yards might seem similar to another at the same average, but if one hits 70 yards in five of six games while the other alternates between 120-yard explosions and 40-yard duds, their betting profiles differ dramatically. Tracking hit rates against various thresholds reveals consistency patterns that inform how confident you should be in your projections.
Standard deviation measures this variance mathematically. Players with high standard deviations in their performance produce less predictable outcomes, making their props riskier bets even when you correctly assess the average expectation. Low-variance players offer more reliable betting opportunities, particularly for overs that require simply exceeding a threshold rather than massive performance.
Pace-adjusted statistics account for the different environments players face. A receiver on a team that runs 70 plays per game has more opportunity than one on a team averaging 60 plays. Adjusting raw statistics for pace creates apples-to-apples comparisons that unadjusted numbers obscure. Similarly, adjusting for opponent quality normalizes results against schedule difficulty.
Historical trends against specific opponents or opponent types provide contextual data that single-game analysis misses. Some players consistently perform well against zone defenses but struggle against man coverage. Others excel in divisional matchups where familiarity cuts both ways. Mining historical performance data for these patterns requires effort but yields insights unavailable to bettors relying solely on recent results.
The recency versus sample size tradeoff complicates research methodology. Recent games provide the most current picture of player form and role, but small samples produce noisy estimates. Season-long data offers larger samples but may include periods when usage patterns differed from current deployment. Weighting recent performance more heavily while maintaining sufficient sample size represents a reasonable balance, though the optimal approach varies by situation.
Building your own projection models sounds daunting but starts simply. Begin by tracking which factors most strongly predict outcomes in markets you bet frequently. Over time, you can formalize these observations into quantitative models that generate probability estimates for comparison against sportsbook lines. Even rudimentary models outperform intuition-based betting by imposing consistency and identifying systematic errors in your reasoning.
Game Environment Factors
The context surrounding a game shapes player performance as much as individual ability. Environmental factors that receive insufficient weight in casual analysis often drive meaningful departures from baseline expectations.
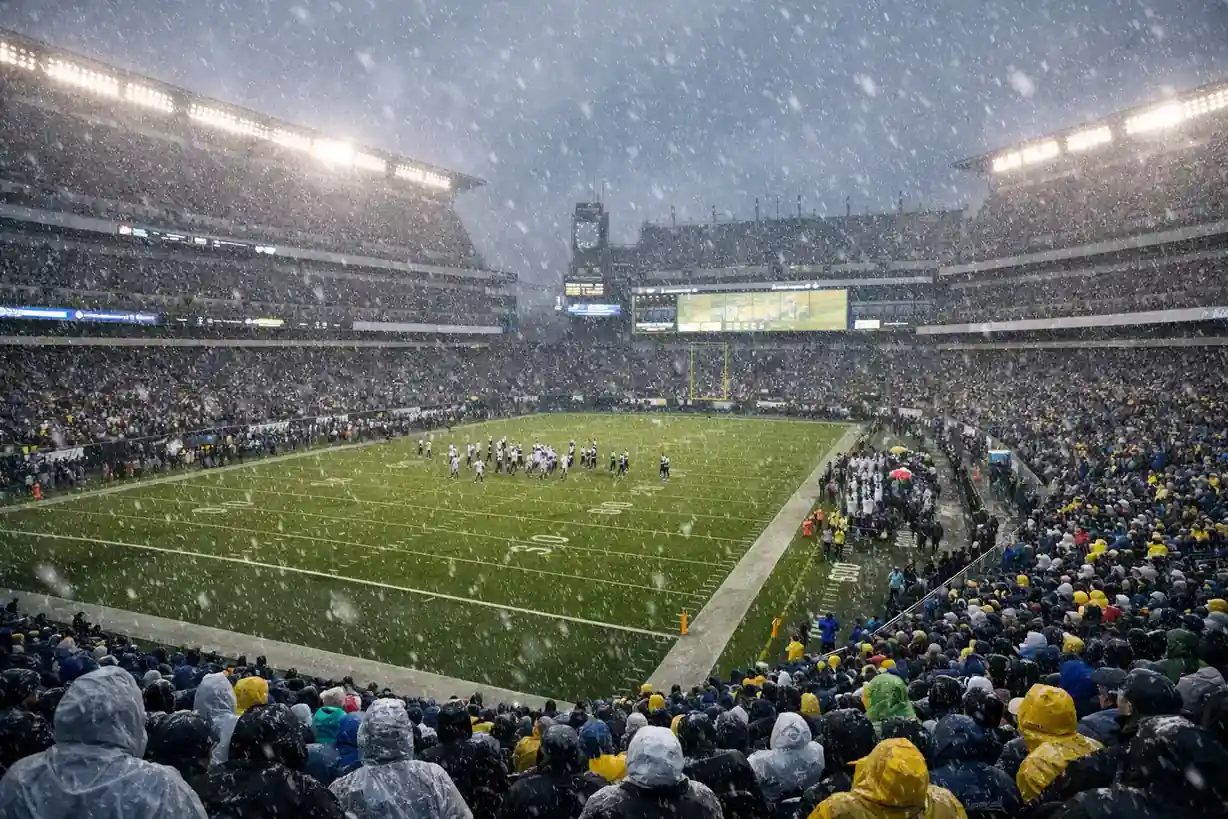
Weather impact on props extends well beyond the obvious recognition that wind and rain affect passing games. Cold temperatures reduce hand dexterity and ball grip, increasing fumble risk and potentially suppressing completion percentages. Extreme heat in early-season games can affect stamina and play-calling as teams manage fatigue. Even humidity levels influence how footballs behave in flight.
Wind presents the most significant weather variable for prop betting. Sustained winds above 15 miles per hour measurably suppress passing production, and gusts above 20 miles per hour can make deep passing nearly impossible. Quarterbacks in windy games often see reduced passing yards despite maintained volume, as teams shift toward shorter routes that are less affected by conditions. Running back rushing props often benefit from these same conditions as offenses lean on the ground game.
Precipitation effects depend on intensity and type. Light rain or snow changes games less than many bettors assume, as modern field conditions and equipment handle modest moisture reasonably well. Heavy precipitation creates more significant impact, reducing both passing efficiency and defensive ability to cover receivers. The uncertainty cuts both ways, which is why prop markets do not always adjust as much for precipitation as wind.
Indoor versus outdoor games create systematic differences in prop expectations. Dome games eliminate weather variance entirely, typically supporting higher passing volume and efficiency. Quarterback props tend to perform better indoors, where consistent conditions allow offensive game plans to execute without environmental interference. The game totals at dome venues run several points higher than outdoor equivalents, reflecting this increased offensive output.
Outdoor games introduce the weather factors described above plus additional venue-specific considerations. Some stadiums have notable wind patterns that affect particular areas of the field. Altitude at Denver’s Mile High Stadium influences both kicking and passing mechanics. Extreme weather venues like Green Bay, Chicago, and Buffalo produce more variable player performances than climate-controlled facilities.
Game pace and total analysis provides the macro framework for individual prop projections. Higher game totals correlate with more plays, more yards, and more touchdowns distributed across players on both teams. When oddsmakers project a 52-point total, they are implicitly projecting conditions favorable to offensive production that should flow through to player props. Lower totals suggest the opposite: defensive games with fewer opportunities for counting stats.
The relationship between game total and specific player props runs through expected possessions and scoring drives. More total points generally mean more possessions that enter scoring range, though efficiency gains can produce high totals from fewer drives. Decomposing the projected total into expected possession counts and average drive outcomes sharpens your analysis of which players will benefit from the overall game environment.
Pace of play amplifies or dampens game total implications. Two games with identical 48-point totals might feature very different play counts if one features up-tempo offenses and the other includes teams that grind clock. The higher-pace game offers more opportunities for volume-based props like receptions and rushing attempts, even if the scoring projection is similar.
Matchup Analysis
Individual player-versus-opponent matchups drive prop outcomes more directly than aggregate team statistics suggest. Drilling down into specific positional battles reveals edges that team-level analysis obscures.
Defense versus position rankings provide a starting framework but require interpretation. A defense ranked 25th against the pass by total yardage might rank 10th when adjusted for opponent quality and pace. Rankings based on yards per attempt or success rate often prove more predictive than raw yardage totals. Choosing the right metrics for matchup analysis prevents misleading conclusions drawn from noisy statistics.
Not all defenses struggle against all aspects of a position group equally. Some defenses rank poorly against tight ends specifically while limiting receivers effectively. Others give up yards between the twenties but tighten in the red zone. Matching the specific player’s role against the specific defensive weakness produces sharper predictions than generic position-versus-defense comparisons.
Cornerback matchups for wide receiver props represent the most granular matchup analysis available. When an elite shadow corner follows a team’s top receiver across formations, that receiver’s production typically declines while targets shift to secondary options. Knowing which defensive coordinators deploy shadow coverage and which corners merit such treatment allows you to anticipate these shifts before lines adjust.
Slot defenders and boundary corners require separate evaluation. A defense might have a lockdown outside corner paired with a vulnerable slot defender, creating opportunities for slot receivers that overall team pass defense statistics would not predict. Similarly, some corners struggle against specific route types or receiver body types, creating exploitable matchups even against generally effective defenders.
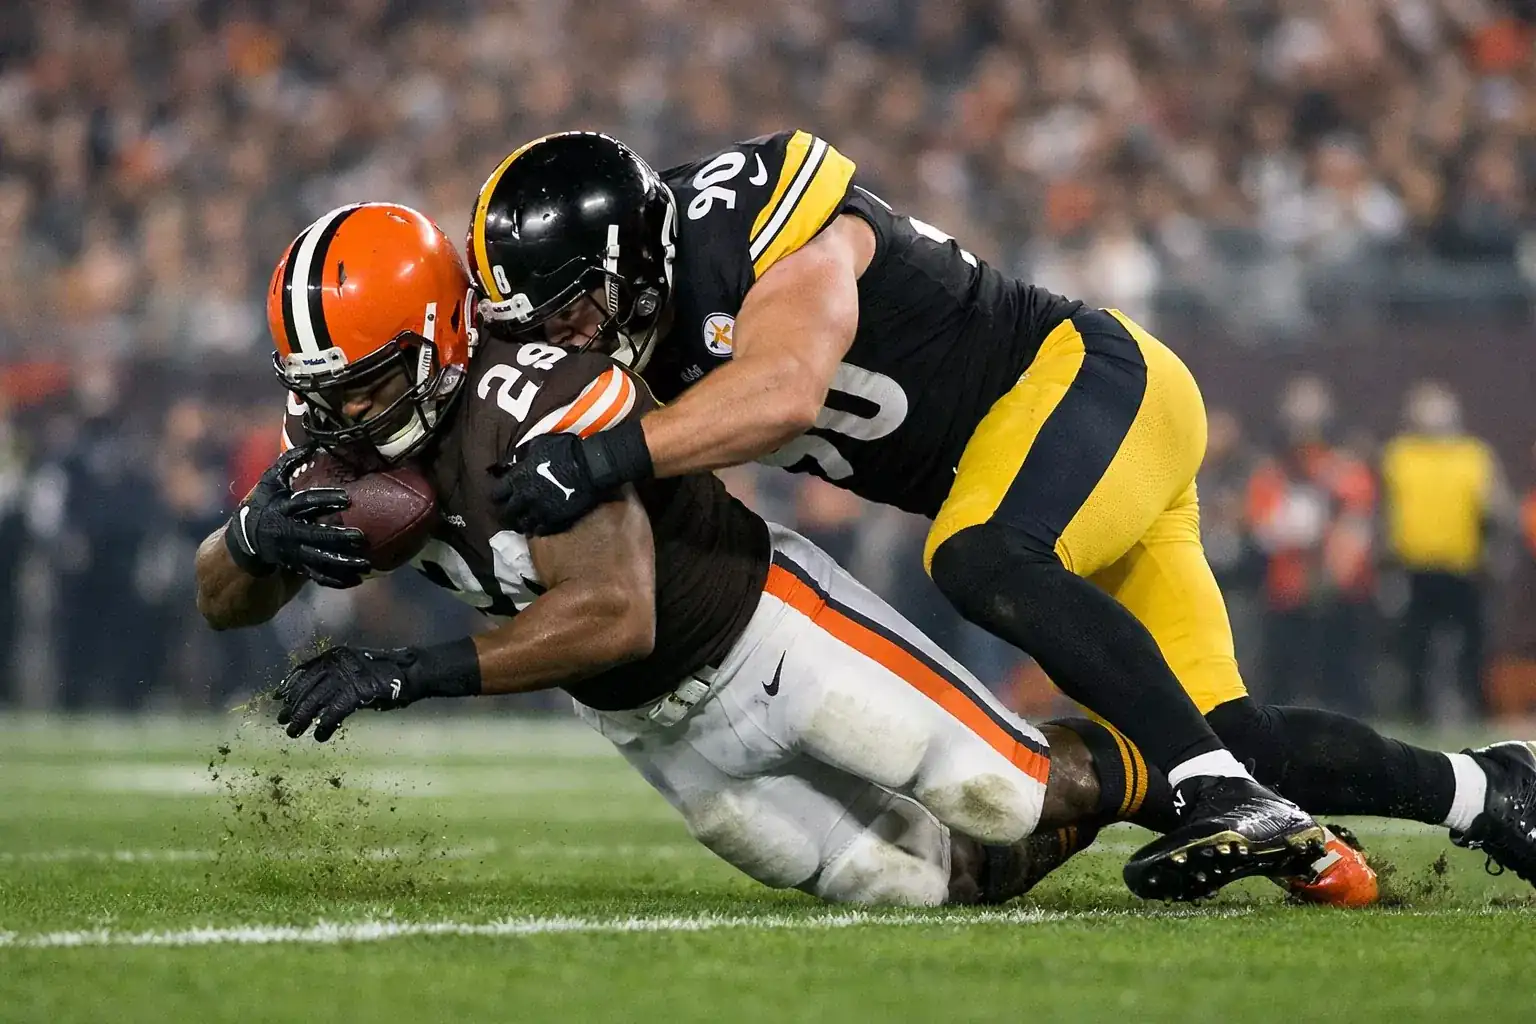
Run defense for running back props demands similar specificity. Interior run defense differs from edge run defense, and teams deploying different rushing schemes attack these areas differently. A running back on a team that runs primarily between the tackles faces different matchup dynamics than one whose carries come predominantly on outside zone plays.
Defensive line personnel changes affect run defense more immediately than secondary changes affect pass defense. If an interior defender is injured or limited, inside rushing lanes open up in ways that create value on running back props. Monitoring injury reports for defensive linemen, not just skill position players, adds an information advantage that many bettors neglect.
Blitz tendencies influence both quarterback and running back props. Defenses that blitz frequently create more variance in passing outcomes and sometimes open running lanes when linebackers vacate their gaps. Conversely, defenses that play conservative coverage may limit big passing plays while allowing methodical yardage accumulation.
Game script expectations interact with matchup analysis. A favorable rushing matchup matters less if the team projects to trail and abandon the run. A tough pass defense presents less challenge if the opponent’s lead forces them into prevent coverage in the fourth quarter. Integrating projected game flow with static matchup assessments produces more accurate prop predictions.
Injury and News Analysis
Information moves prop markets, and staying ahead of widely available news creates opportunities before lines adjust to reflect new realities. Injury reports, practice participation, and roster moves all influence prop pricing in ways that informed bettors can exploit.
Target share changes following injuries to primary receivers represent one of the most reliable prop betting angles. When a team’s number-one target goes down, those vacated targets redistribute to remaining players. Secondary receivers and tight ends often see elevated opportunities that their prop lines initially fail to reflect. The market eventually adjusts, but early bettors who anticipate the redistribution capture value that evaporates as information spreads.
The same logic applies to running back injuries. When a starting back is ruled out, his replacement typically inherits a workload that their previous usage patterns would not suggest. Prop lines for backup running backs often lag behind their actual expected production in these situations, particularly when the injury occurs close to game time and markets have less time to adjust.
Backup opportunities extend beyond simple injury replacement. Some coaches rotate players more heavily in specific game situations, and understanding these patterns reveals which backups might see elevated usage even with starters healthy. Third-down specialists, goal-line backs, and situational pass rushers all have roles that create prop opportunities despite limited overall snap counts.
Monitoring practice reports throughout the week provides early signals about injury developments. A player limited in Wednesday practice might not concern the market, but continued limitations through Friday raise questions that full injury reports later confirm. Bettors who track practice participation develop intuitions about which limitations signal real game-day impact versus standard veteran rest.
Coaching tendencies regarding injured players vary significantly. Some coaches err toward caution, sitting players who might play through minor issues elsewhere. Others push players back onto the field quickly. Knowing these tendencies by team helps calibrate how much weight to give various injury designations.
Weather forecasts for outdoor games deserve treatment as information that affects props similarly to injury news. Forecasts become more reliable as game time approaches, and checking conditions Saturday night for Sunday games sometimes reveals weather developments that markets have not fully incorporated. A sudden wind forecast or unexpected precipitation can shift optimal prop positions away from their Thursday lines.

Line Shopping for Props
Line shopping—comparing prices across multiple sportsbooks before placing any bet—matters more for props than for any other betting market. The divergence in prop pricing across books frequently exceeds the difference between profitable and unprofitable betting.
Comparing sportsbooks reveals systematic differences in how various operators price props. Some books consistently offer better quarterback props while others excel in rushing markets. These patterns emerge from different data sources, modeling approaches, and liability management strategies. Learning which books tend to offer the best prices in your preferred markets directs your shopping efforts efficiently.
The mechanics of prop line shopping require maintaining accounts at multiple legal sportsbooks. Building this infrastructure takes initial effort but pays recurring dividends. Before placing any prop bet, checking at least three or four books takes only moments with modern apps and line comparison tools. The habit becomes automatic with practice.
Finding the best numbers often yields differences of multiple points on prop totals or significant odds differences on yes/no propositions. A receiving yards line of 62.5 at one book versus 65.5 at another represents a meaningful edge for bettors targeting the over. Similarly, an anytime touchdown at -125 versus -150 changes the implied probability threshold for profitability.
Line comparison tools aggregate prop pricing across legal sportsbooks, displaying the best available odds at a glance. These tools save time and ensure you do not miss value sitting at a book you might have overlooked. Several free and subscription options exist, and the investment in premium tools often pays for itself through improved line selection.
The timing dimension of line shopping adds complexity. Lines move throughout the week as money enters markets and information emerges. The best line available Tuesday might not be the best by Sunday morning. Deciding when to lock in favorable numbers versus waiting for additional information involves strategic judgment that improves with experience.

Bankroll Management
Sustainable prop betting requires treating your bankroll as a finite resource that must survive variance to reach the long-term profitability that good strategy creates. The best analysis in the world produces losing months, and proper bankroll management ensures those losing stretches do not end your betting career.
Unit sizing for props should reflect both the variance inherent in prop markets and your confidence in individual selections. A standard approach uses 1-2% of your bankroll per prop bet, smaller than the 2-3% sometimes used for spread betting. This conservative sizing acknowledges that props carry higher juice and often more outcome variance than traditional markets.
Scaling unit size with confidence levels requires honest self-assessment. Reserving larger bets for situations where multiple factors align creates appropriate risk differentiation, but overconfidence leads bettors to over-size routinely. Tracking your results by confidence tier reveals whether your subjective assessments actually correlate with outcomes.
Managing variance means accepting that short-term results provide limited information about long-term expected value. A week of losing prop bets might reflect bad luck rather than bad process. Conversely, a hot streak does not validate an approach that will regress over time. Focusing on decision quality rather than outcome quality maintains emotional equilibrium through inevitable swings.
Separate bankrolls for props versus other betting keeps your various activities distinct. Prop betting variance should not threaten your spread betting bankroll, and vice versa. This separation also facilitates accurate tracking of results by market type, providing data for evaluating where your approach succeeds and where it needs refinement.
Stop-loss discipline prevents catastrophic sessions from destroying weeks of accumulated profit. Setting daily or weekly loss limits and honoring them regardless of how unfair the losses feel protects your bankroll from the emotional decisions that follow extended losing runs. The discipline to walk away when limits are reached separates professionals from recreational bettors.
Withdrawal practices affect your psychological relationship with your bankroll. Periodically withdrawing profits converts paper gains into real money and reinforces that betting produces tangible results. The appropriate frequency depends on your bankroll size and goals, but never withdrawing creates an abstract relationship with money that can lead to careless decisions.
Advanced Concepts
Finding positive expected value props requires comparing your probability estimates against the implied odds offered by sportsbooks. If you assess a 55% chance of an outcome priced at -110 (52.4% implied), you have identified positive expected value. Systematically betting +EV opportunities produces long-term profit regardless of short-term variance.
Building this capability involves tracking your predictions and their outcomes over time. When you consistently assess probabilities higher than bookmaker-implied odds, and those outcomes hit at rates matching your assessments, you have validated an edge worth exploiting. When your assessments prove systematically optimistic or pessimistic, you have identified calibration errors to correct.
Tracking your results enables data-driven refinement of your approach. Recording every bet with the reasoning behind it, the odds obtained, and the outcome creates a database for analysis. Patterns emerge over time: perhaps your quarterback overs perform well while your running back props struggle. This information guides specialization toward your areas of demonstrated competence.
Closing line value analysis compares the odds you obtained against the closing line before game time. Consistently beating closing lines suggests you are capturing value that the market eventually recognizes. This metric provides a leading indicator of profitability more reliable than short-term win-loss records.
Conclusion
Profitable NFL prop betting emerges from systematic research, disciplined execution, and continuous refinement based on tracked results. The strategies outlined here provide a framework, but applying them successfully requires commitment to the process over months and years. The market does not surrender profits easily, but bettors willing to do the work find opportunities that casual players miss.
Escrito por los editores de «nfl Prop Bets».